
DocumentationForms & requestsWeplanify forms: requests, reports and surveysAsk your teams with a survey or a quiz
Read the results of a survey
In Weplanify, a survey's Results tab shows participation, each question as a chart, every free answer and, for a recurring survey, the trend over time.
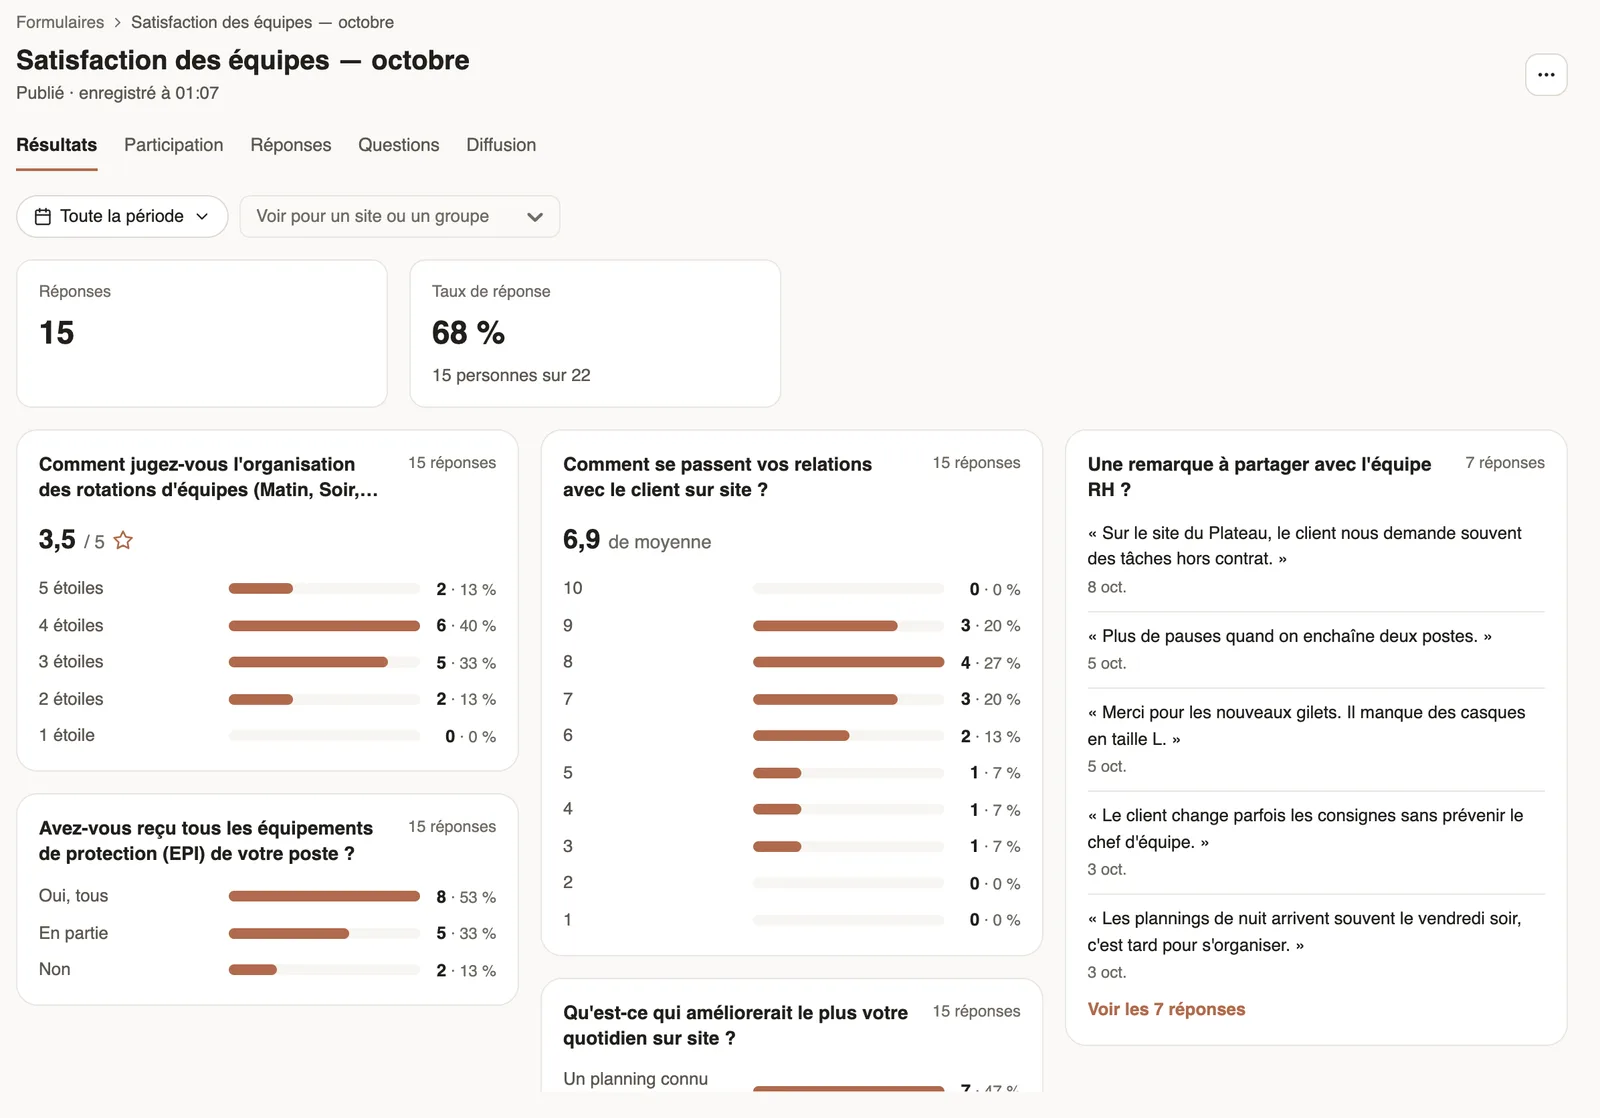
In Weplanify, a live survey opens on the Results tab: number of answers, response rate, then one card per question.
Steps
- In Requests → Forms, open the survey: the Results tab shows, on All time.
- Change the period if needed, or pick a site or a group in See for a site or a group.
- Read each question: average and spread of ratings, spread of a scale, share of each choice.
- Under a free question, click See the … answers to read them all.
Good to know
- For a multiple choice, percentages are of respondents: their total can exceed 100 %.
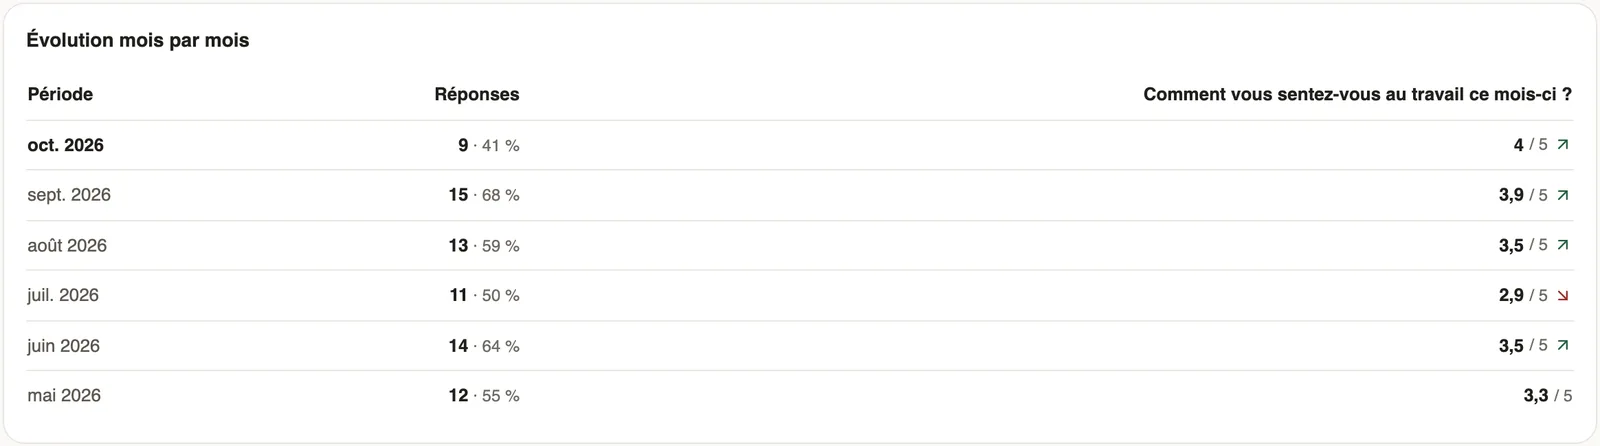
- A survey answered every week or every month shows the trend block: the last 6 periods, the number of answers and the average rating, with an arrow compared to the previous period.
- Anonymous survey: with fewer than 5 answers in the chosen period, site or group, results are hidden to keep answers anonymous; a row of the trend can also show hidden.
- Answers one by one are in the Responses tab.
- For a site or a group, the response rate and the trend are based on the people of that site or group.
Go further
Follow, approve and export a form's responsesIn Weplanify, a form's Responses tab sorts answers by status, opens each one on the side so you can decide, and exports everything to Excel.Ask your teams with a survey or a quizIn Weplanify, a survey collects your teams' views and a quiz checks what they know, with no approval step, plus results, participation and reminders.